First things first, what are Capptions Direct dashboards?
Captions Direct dashboards are vital tools that can assist you in analyzing and monitoring every aspect of your workflow. From having an overview of the number of tasks completed, missed, and dismissed to which user is responsible at each stage of the workflow. Dashboards are loaded with valuable data that can assist you and your organization in achieving and maintaining EHS compliance.
let's explore the various methods you can use to gain a deeper understanding of your organization's performance.
How to access your Dashboards
Click the red hotspot in the video below to see the steps 👇
Step 1: Log in to the Captions Direct web portal
You can only view the dashboards on the Capptions Direct web portal. Click the link to log in.
Step 2: Select your Organization
Once logged in, you will land in your Personal Sandbox. Click on the dropdown arrow and select the Organization you would like to view
Step 3: Click on Results
You will automatically land on the Dashboard tab and Workflow Results. Here is where you will find all data related to each workflow.
How to view data on the Dashboard
A Reminder, every workflow that you have created will have its own Dashboard.
The information on this page will show.
- All workflows that have been published and started
- Primary data highlighting the number of open, stuck, and completed forms per workflow.
- A search bar on the top right-hand corner and a filter you can use to select the order of appearance.
Applying Filters
Click the red hotspot below to see the next steps 👇
A filter allows you to refine the data displayed on the dashboard by selecting specific criteria. The purpose of a filter is to help you focus on the data relevant to your needs and to enable you to make more informed decisions based on that data.
You can filter any workflows you want to view in the following ways.
- Search bar
Simply type into the Search bar the specific workflow you would like to view data on. - Sort By Tab
Click on the Sort by tab to view the drop-down options. Filter the workflows by last started, last updated, Open, Completed, or Stuck. - Extended Filtering
The extended filter option is available on each page of the dashboard. The filter icon is always located on the top right-hand corner of each page.
Step 1: Click the filter Icon.
On the top right-hand corner, you will find a filter Icon. Click the icon to view available filters.
Step 2: Select Filters.
You can narrow down the data you would like to view by filtering the workflows according to Date range, Status, Teams, Workflow, or Users.
Viewing data on each Dashboard
Step 1: Click on a workflow dashboard.
When accessing the data of a particular workflow, you will see these metrics.
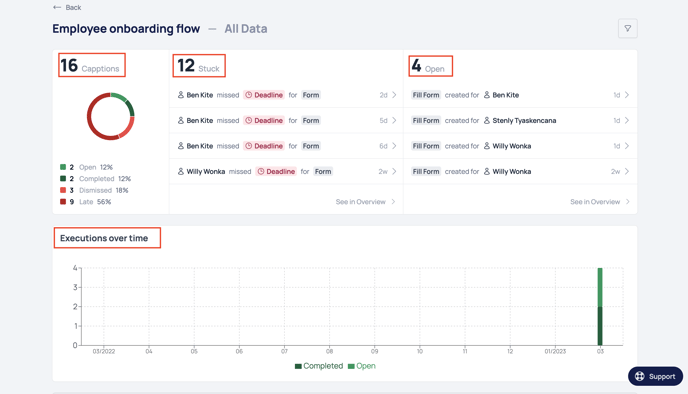
- Capptions:
This will show you the total Capptions used for a particular Workflow. Remember, a Capption is defined as the sum of all actions taken within a workflow by an end-user. The data that falls under this metric, therefore, extends further by detailing the percentage of Open, Completed, Dismissed, and Late Capptions. - Stuck:
This metric is an extension of the Capptions metric. It highlights data on which users in the workflow are responsible for the late, dismissed, or canceled tasks. - Open:
The metric provides an overview of all the workflows that are still “In Progress” it highlights which user in the workflow is still required to complete a task. - Executions overtime:
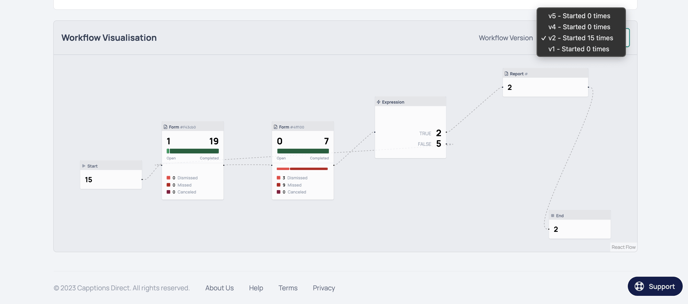
A table showing how many executions were performed during the workflow over a defined period of time - Workflow Visualisation:
A visual representation of the workflow that the data is collected from. Using the filter on the top right-hand corner of this section of the dashboard, you are able to filter different versions of the Workflow.
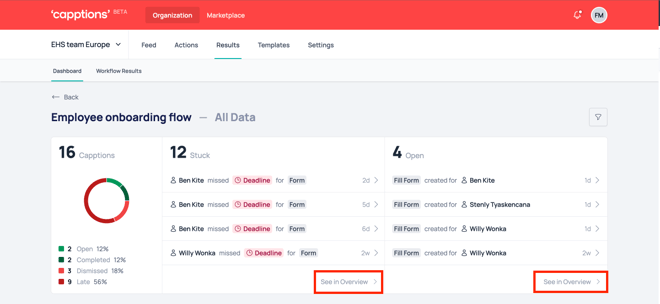
Step 2: Click See in Overview
For the two metrics, Stuck and Open, You can expand the view of the data by clicking on See Overview. This displays a full activity log.
The activity log is automatically filtered to display the data according to the Status of each task as Dismissed, Cancelled, and Missed. The activity log will display data categorized by the name of the Workflow and its version, Start date and Timestamp, Status, Team responsible for completing tasks in the workflow, and Initiator of the Workflow. It also provides you with the option to Restart the workflow for each initiator.
Click the hotspot in the video below to see the steps. Green hotspots are informational.
2.2 Open
The activity log is automatically filtered to display the data according to the status of each task as In Progress. The activity log will display the name of the Workflow and its version, the Start date and Timestamp, the Status, the Team responsible for the workflow, and the Initiator of the workflow.
Click the hotspot in the video below to see the steps. Green hotspots are informational.
Step 3 Click Details
For each version completed of the workflow, you are able to view detailed action logs on all activity that has taken place throughout the lifecycle of the Workflow. You are also able to view the information that each member of your team submitted by clicking the Submissions tab. The View Report tab will allow you to view the report that was generated during the Workflow.
Now that you are an expert in tracking your organization's performance, Here are a few terms to note :
- Each workflow will have its own dashboard
- An organization, therefore, can have multiple dashboards within its environment.
- Once a workflow has been started, a dashboard will automatically be created, and data from the process will be generated.
Essential terms to understand on the dashboard
| Capption | The sum of all actions taken within a workflow by an end-user |
| Stuck | A term that categorizes workflows that are not able to continue to the next stage due to the user being canceled, dismissed, or late |
| Open | A term that categorizes workflows that have been started and are in progress |
| Completed | A term used to label the status of a task within the workflow. Once a user has submitted a task assigned to them, it will be marked as done |
| Dismissed | A term used to label the status of a task within a workflow. If a user decides that they do not need to complete a task assigned to them, they can choose to dismiss it. |
| Late | A term used to label the status of a task within a workflow. If a task with a deadline was assigned to a user and the user does not meet the deadline. The task is labeled as being late. |
| Executions over time | A term used to categorize the comparison of workflows that have been opened to those that have been completed over a period of time. |
| Workflow Visualisation | A visual representation of the workflow that the dashboard is collecting data from |
| Actor | A term used to describe the user who has executed a task |
| Entity name | A term used to categorize the tasks listed on the Workflow lifecycle |
| Workflow Lifecycle | A log of all the actions that were taken during the Workflow. |
And that's how easy it is!
We hope this article is helpful in getting started with the Capptions Direct dashboards. If you have any questions or concerns, please do not hesitate to contact our customer support team.
Thank you for choosing Capptions Direct as your EHS management software. We look forward to helping you make your workplace safer and more efficient!