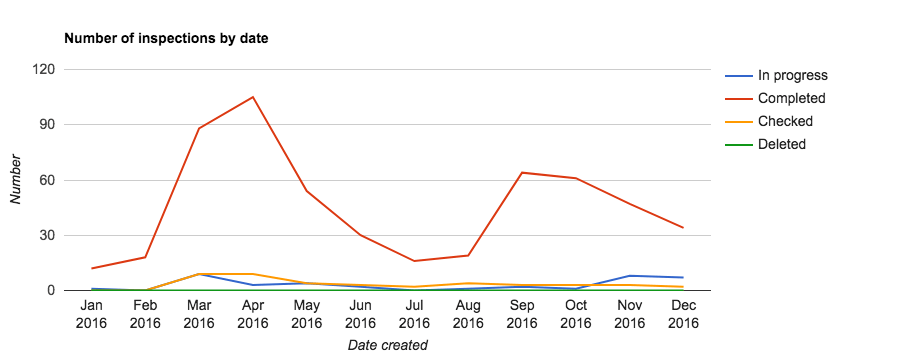
In the 'View report' page you will be able to find the dashboard with different to choose chart types. Currently, we've got four types available:
- Line chart
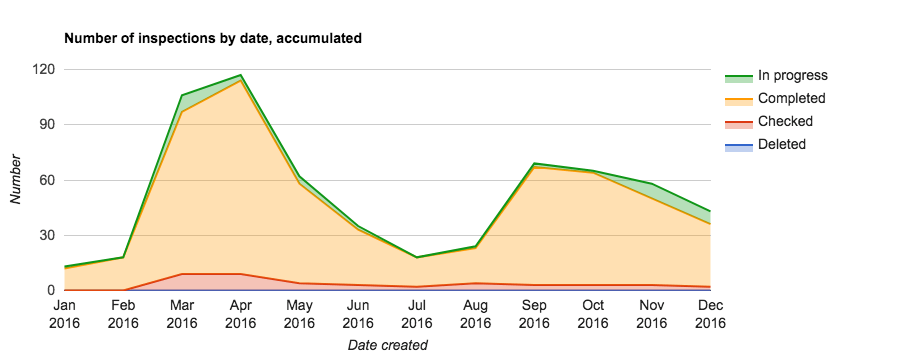
- Stacked area chart
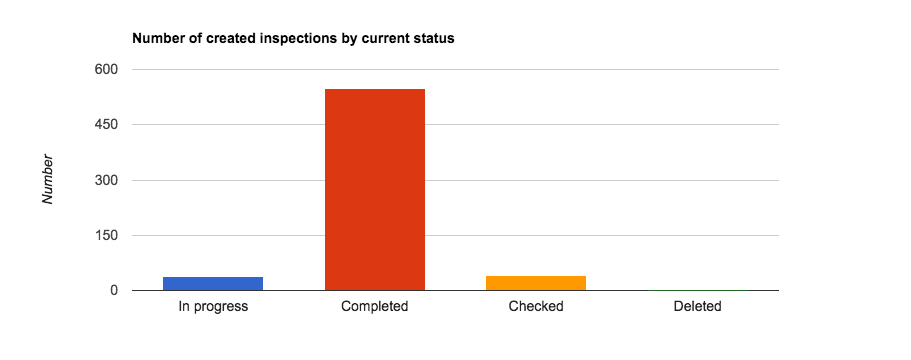
- Bar chart
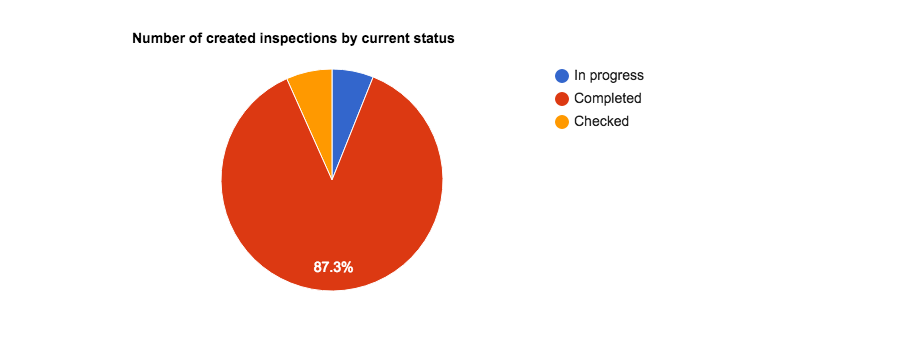
- Pie chart
In the 'View report' page you will be able to find the dashboard with different to choose chart types. Currently, we've got four types available: