We are proud to present our brand new reporting 2.0!
You might say it's not only an improvement of the existing reporting module, it has a completely new look & feel and a lot of new functionality.
Beside reports on incidents, you can also create different kinds of charts on logs, actions, inspections and users. Select the period you want to report on, the chart of your preference and what kind of grouping or filtering you want to see in order to get the information you need.
To get started, go to the reporting module 'view reports' on the homepage:
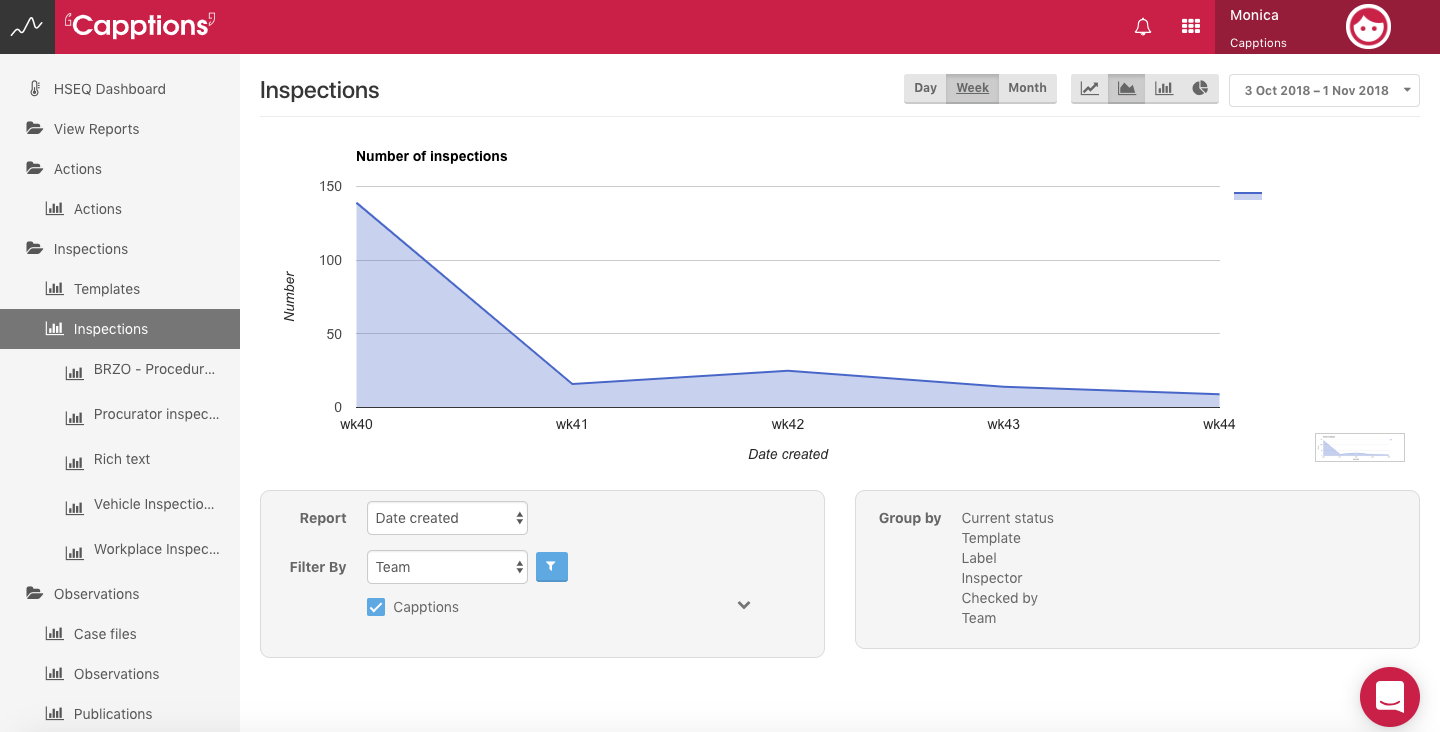
Select the group or subgroup you want to report on and make your selection(s). For example an incident report, grouped on status, as a stacked area chart:
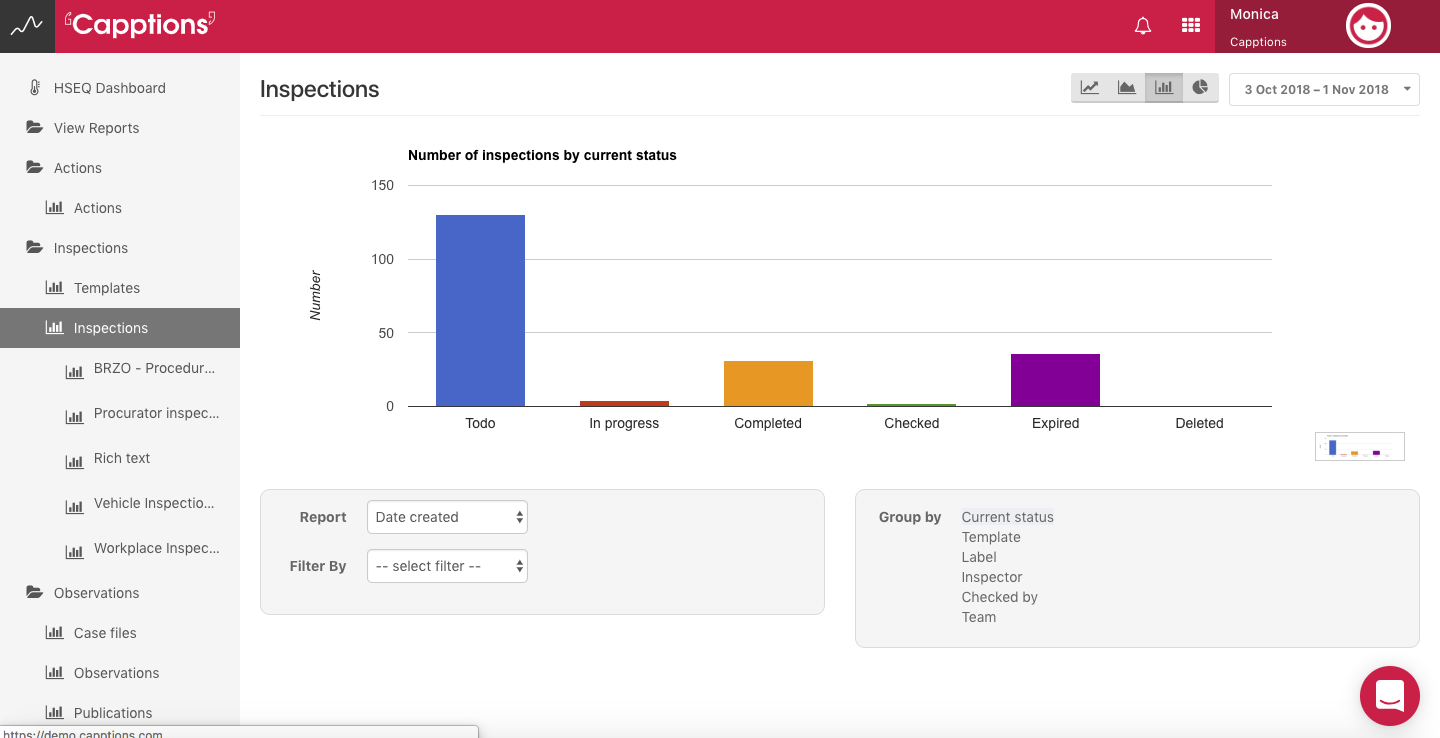
Or, choosing a group category, for instance, the current status in a bar chart:
We can show you lots of other examples, but the best way to get to know reporting 2.0 is to use it yourself.
As a customer, you have a subscription on innovation and that means that we offer you new functions based on your feedback and our vision every release. So please don't hesitate to share your experience with the new reporting module with us.
Also in this release we added the possibility to delete draft publications, the layout of the download of inspections to Word improved and we performed a couple of small bug fixes and performance improvements.